CBRE December 2020
The 2020 holiday season will undoubtedly be unlike any other.
Given the significant shift to e-commerce during the pandemic, a greater share of retail holiday sales will be done online. Holiday e-commerce sales grew by a record 14% last year to $167.8 billion. 2020 will shatter that record with a projected 40% increase to $234.9 billion, putting e-commerce’s share of total retail sales at 32%, according to CBRE Research.
Supply chains will be tested as retailers handle a record number of returns. Brick-and-mortar retail return rates typically average between 8% and 10% of total sales throughout the year, according to eMarketer. Total holiday retail sales (November and December) are expected to reach $741.2 billion this year, up just 1.5% year-over-year.2
The surge in e-commerce demand this holiday season will lead to a corresponding spike in returns, according to Optoro, a reverse logistics software provider. E-commerce sales have a much higher average return rate of up to 30%, and this is even higher during the holiday season. With a projected $234.9 billion in online holiday sales this year, e-commerce returns will be at least $70.5 billion—a 73% increase from the previous five-year average.
This flood of returns back into the supply chain will create significant reverse logistics challenges for retailers and 3PLs.
Figure 1: Historical & Projected U.S. Holiday Sales – 2020 E-commerce Sales/Returns

Source: National Retail Federation, CBRE Research, Q4 2020.
Return Costs for Retailers Vary by Product Type
Amid the COVID-19 pandemic, consumers are doing more online shopping for products that support a stay-at-home environment. Optoro’s online proprietary marketplaces, BLINQ and BULQ, have seen an increase in purchases of toys, baby items, electronics, cleaning supplies, appliances and health & beauty goods.
Knowing which products are purchased online is important for a retailer’s bottom line, as different products have varying levels of depreciation. For example, Optoro estimates that the value of fashion apparel depreciates by 20% to 50% over an eight-to-16-week period, creating urgency to get returned items back up for sale.
Apparel retailers likely will see the biggest rise in reverse logistics costs as many customers buy several of the same items to try on and return the ones that don’t fit. Apparel has the highest return rate for online purchases, from 30% or as much as double that of in-store purchases.
Electronics are prone to quickly lose value since rapid innovation leads to new models of the same product.
Other typical gift-giving segments, such as electronics, small appliances, jewelry and accessories, may see higher reverse logistics costs due to the need to inspect, test, wipe customer data, reimage and sometimes repair for warranty purposes. Electronics are prone to quickly lose value since rapid innovation leads to new models of the same product.
There likely will be an increase in the giving of physical gifts this year, with less giving of experience-related gifts like tickets to concerts and sporting events due to pandemic-related restrictions.
Omnichannel Return Models Help Retailers Keep Customers
A positive returns experience is critical for retailers to retain customers. A recent survey by Optoro found that 42% of consumers decided to never again shop with a retailer with which they had a negative returns experience. Customers also say they want several return options. Approximately 80% of respondents to a recent National Retail Federation survey (pre-COVID-19) said they prefer to make returns in-store. Yet due to COVID-19, there may be a reduction of in-store returns this year and a commensurate increase in shipped returns.
Many retailers’ returns policy is a competitive differentiator, especially during the holiday season, and has become increasingly important to attract and retain customers. For example, Happy Returns—a software and reverse logistics company—provides a service for customers to return online purchases at an in-store kiosk. Some retailers without physical locations have partnered with brick-and-mortar retailers, allowing customers to return items in the store. Amazon offers free returns for Prime members in more than 1,150 Kohl’s locations.
Optoro reports that 97% of consumers will buy from a retailer again after having a positive returns experience.3 The company also found that by incentivizing customers to exchange rather than return purchases, they can maximize profits and increase order values by as much as 32%.4
Many retailers’ returns policy is a competitive differentiator, especially during the holiday season, and has become increasingly important to attract and retain customers.
The High Cost of Returns
Although many customers expect a free returns policy, the cost to return items is significant for retailers. Optoro reports that the costs of customer care, transportation, processing, discount loss and liquidation loss can conservatively amount to 59% of the sale price of a $50 item. Providing customers the option to return their online purchases in-store can lower call center, transportation, processing and discount costs. Nevertheless, significant investment in technology is needed for retailers to seamlessly process returns and correctly reposition them for sale.

Reverse Logistics: The Mystery Supply Chain
The return process for an online order involves several steps that include the cost of pickup, handling and many “touches” as the item moves back into inventory. These steps include:
- A customer returns an item to the store or parcel customer counter, or it is picked up by a carrier, such as UPS, FedEx and USPS.
- The store may do a first assessment to determine whether the item is defective, or its packaging is in good condition and it’s still in-season so it can be put back on the shelf at full price or marked down.
- If shipped, the item is typically returned either to that store’s distribution facility or to a centralized returns center.
- Once received at the retailer’s distribution or returns center, items are again assessed for defectiveness, packaging condition, excess product and seasonality.
- Some defective products may be repaired or refurbished, while excess and out-of-season products may be sold with additional warranty through a discount retail channel or liquidator.
- Remaining returns are typically either sent back to the vendor for credit, donated, sold in bulk to resellers or destroyed.

In forward logistics, retailers communicate to their distribution centers (DC) what is inbound from their vendors and communicate to their stores what is inbound from the DC. This transparency enables better planning of store staff levels needed to move products from dock to shelf just in time to make the next sale.
In reverse logistics, by contrast, retailers don’t know what products and how much of each will be sent back from where and by what method, preventing adequate planning. This lack of transparency causes challenges that translate into higher costs for the retailer.
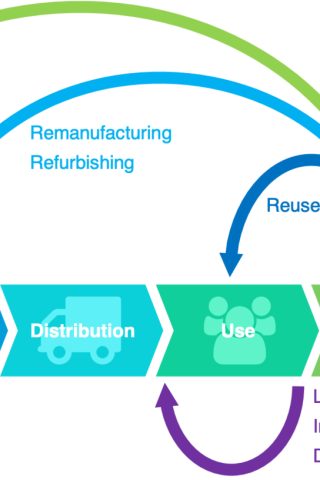
Figure 2: The Complicated Flow of Reverse Logistics

Source: “Retail Supply Chain Management” by James B. Ayers & Mary Ann Odegaard, CBRE Supply Chain Advisory, 2019.
Reverse Logistics in Hybrid Store of the Future
Some retailers are redesigning their distribution and fulfillment strategies to meet heightened expectations in today’s omnichannel environment, paving the way for a new hybrid store model that will handle multiple forms of fulfillment and inventory control as well as reverse logistics. For this to occur, a robust portion of the store’s overall footprint will need to be utilized for storage, sorting/packing and shipping/receiving.
The hybrid store’s design will have a major returns handling component. Part of a retailer’s overall strategy will be to encourage online customers to bring returns to the store. Even smaller stores will need to have some amount of space for returns fulfillment.
Reverse Logistics and Real Estate Opportunity
Optoro has found that a retailer’s supply chain requires four to seven times more space allocation at peak periods. With the influx of customer and store orders, space for forward fulfillment is at a premium. Warehouse space options are limited, with 22 U.S. industrial markets having vacancy rates below the national average of 4.7% as of Q3 2020. And more forward orders mean more inventory coming back, increasing space demand especially during the holiday season.
A reverse logistics supply chain requires an average of up to 20% more space and labor capacity compared with forward logistics, according to Optoro. The type of products being returned drive the real estate requirements and space criteria. Typically, second-generation space is preferred over modern, Class A facilities. Lower ceiling heights are more appropriate since the activities within the space are high touch with slower processing and the varying size of the pallet loads makes them difficult to stack or safely store in high racks.

Forecast e-commerce growth will result in an additional 1.5 billion sq. ft. of industrial space over the next five years, according to CBRE Econometric Advisors.
Many companies that currently occupy second-generation space are expected to upgrade to newly constructed buildings, which will allow reverse logistics occupiers to lease a greater portion of Class B space. As much as 400 million sq. ft. could be used to process returns.
Reverse logistics and inventory control are also contributing to increased size requirements for warehousing. The average size of warehouse leases of more than 100,000 sq. ft. was a record 272,000 sq. ft. in Q3 2020.
3PLs to the Rescue
Many retailers use 3PL providers for their returns management to free up premium space for forward logistics. This is a viable option for retailers that have a thin supply chain network and allows them to focus on other aspects of their business. As a result, 3PL providers have become a major driver of industrial real estate demand. As of October 2020, 3PLs accounted for 27.5% of the transaction volume for deals of 100,000 sq. ft. or more, compared with 21.8% for e-commerce occupiers.
Large 3PLs that offer reverse logistics services include XPO Logistics, Geodis, FedEx, UPS and NFI Industries.
Figure 3: 3PLs Remain Top Industrial Occupier; YTD Transactions 100K Sq. Ft.+

Source: CBRE Research, Q4 2020.
Sustainable Solutions Help Limit Waste, Recapture Product Value
Reverse logistics is both a cost-control and environmental challenge. Returns produce 5 billion pounds of waste in landfills and 15 million metric tons of CO2 emissions from transportation, according to Optoro. Retailers are attempting to balance consumer demand with sustainability while providing a seamless returns experience to protect their brand and customer loyalty.
Retailers may incentivize customers to reduce returns by employing technologies like augmented reality to provide accurate product assessments before purchasing. Another viable solution is to offer “package-less” return drop-off points. This is especially helpful for consumers who do not have printers or packing materials.
The resale market has grown 21 times faster than the retail apparel market in the past three years.
Secondary marketplaces provide opportunities for product reuse. The resale market has grown 21 times faster than the retail apparel market in the past three years.5 This reduces environmental impact and allows retailers to recapture a small portion of the product’s value.
The Bottom Line
A substantial increase in returns after the 2020 holiday season will create many reverse-logistics challenges that effective real estate and supply chain management can partially address. More important, however, is calibrating the retailer’s product offering by leveraging consumer-use data, product/packaging design and operational data to better understand why an item was returned. This will ultimately alleviate the stress that returns put on supply chains.
Special thanks to Optoro, a Washington, D.C.-based returns technology software provider, that collaborated with CBRE on this report.
For more information on holiday trends, please refer to the 2020 U.S. Retail Holiday Trends Guide
1Source: CBRE forecast based on National Retail Federation data.
2 CBRE Research, “2020 U.S. Retail Holiday Trends Guide”, CBRE Research, September 2020. See report here.
3 “Retail Returns and the Consumer Experience”, Optoro, 2018.
4 Optoro + Returnly Client Performance Data & Analytics (2019/2020).
5 “2019 Resale Report”, ThredUp, 2019.


